Download MonitorUI
MonitorUI
For those that read my in depth coverage on low-level process hunting or any of my blogposts on TrueTree, you know that I’m a stickler for process hunting on macOS. For this reason, I have about a million and one different ways in which I like to monitor process activity on macOS. Perhaps my favorite tool used to track processes in a hurry is Objective-See’s ProcessMonitor. Honestly, an underrated little tool that uses the Apple Endpoint Security Framework to record executed processes and return the details in a nicely formatted json string. This json output can then easily be displayed in other tools, and yet it doesn’t seem that anyone has taken the time to write any. Until now!
Being able to view process data in raw text is great, but it certainly isn’t easy on the eyes. I often find myself pinpointing a process of interest, and then using cmd+f in a text editor in order to find a previous event that it caused, find its parent, or find its children. You get pretty good at it after a lot of practice, but it still isn’t overly practical when doing a long session of reversing or research. Fortunately, this is why Objective-See uses json as its output mode. Anyone can use json for additional tooling!
Today I’m releasing a tool in which i’ve given a very vague name called MonitorUI. But I’m calling it what it is here. This tool is a way to view data collected from ProcessMonitor and load it into a UI that hopefully helps researchers work more efficiently.
How to use it
Nothing tricky here. In order to use MonitorUI all you have to do is create a file using Objective-See’s ProcessMonitor tool. Make sure a few processes run before you stop recording with Ctrl+C.
sudo ProcessMonitor.app/Contents/MacOS/ProcessMonitor > demo.json That file can then be loaded into MonitorUI by selecting the “Import Json” button or by dragging and dropping the json file into the app.
(make note that MonitorUI does not currently support the loading of pretty printed json)

By doing so we’ve made it far easier to track the life cycle of a process. For example, let’s take a look at what happens when a user runs a program written in C that simply calls…
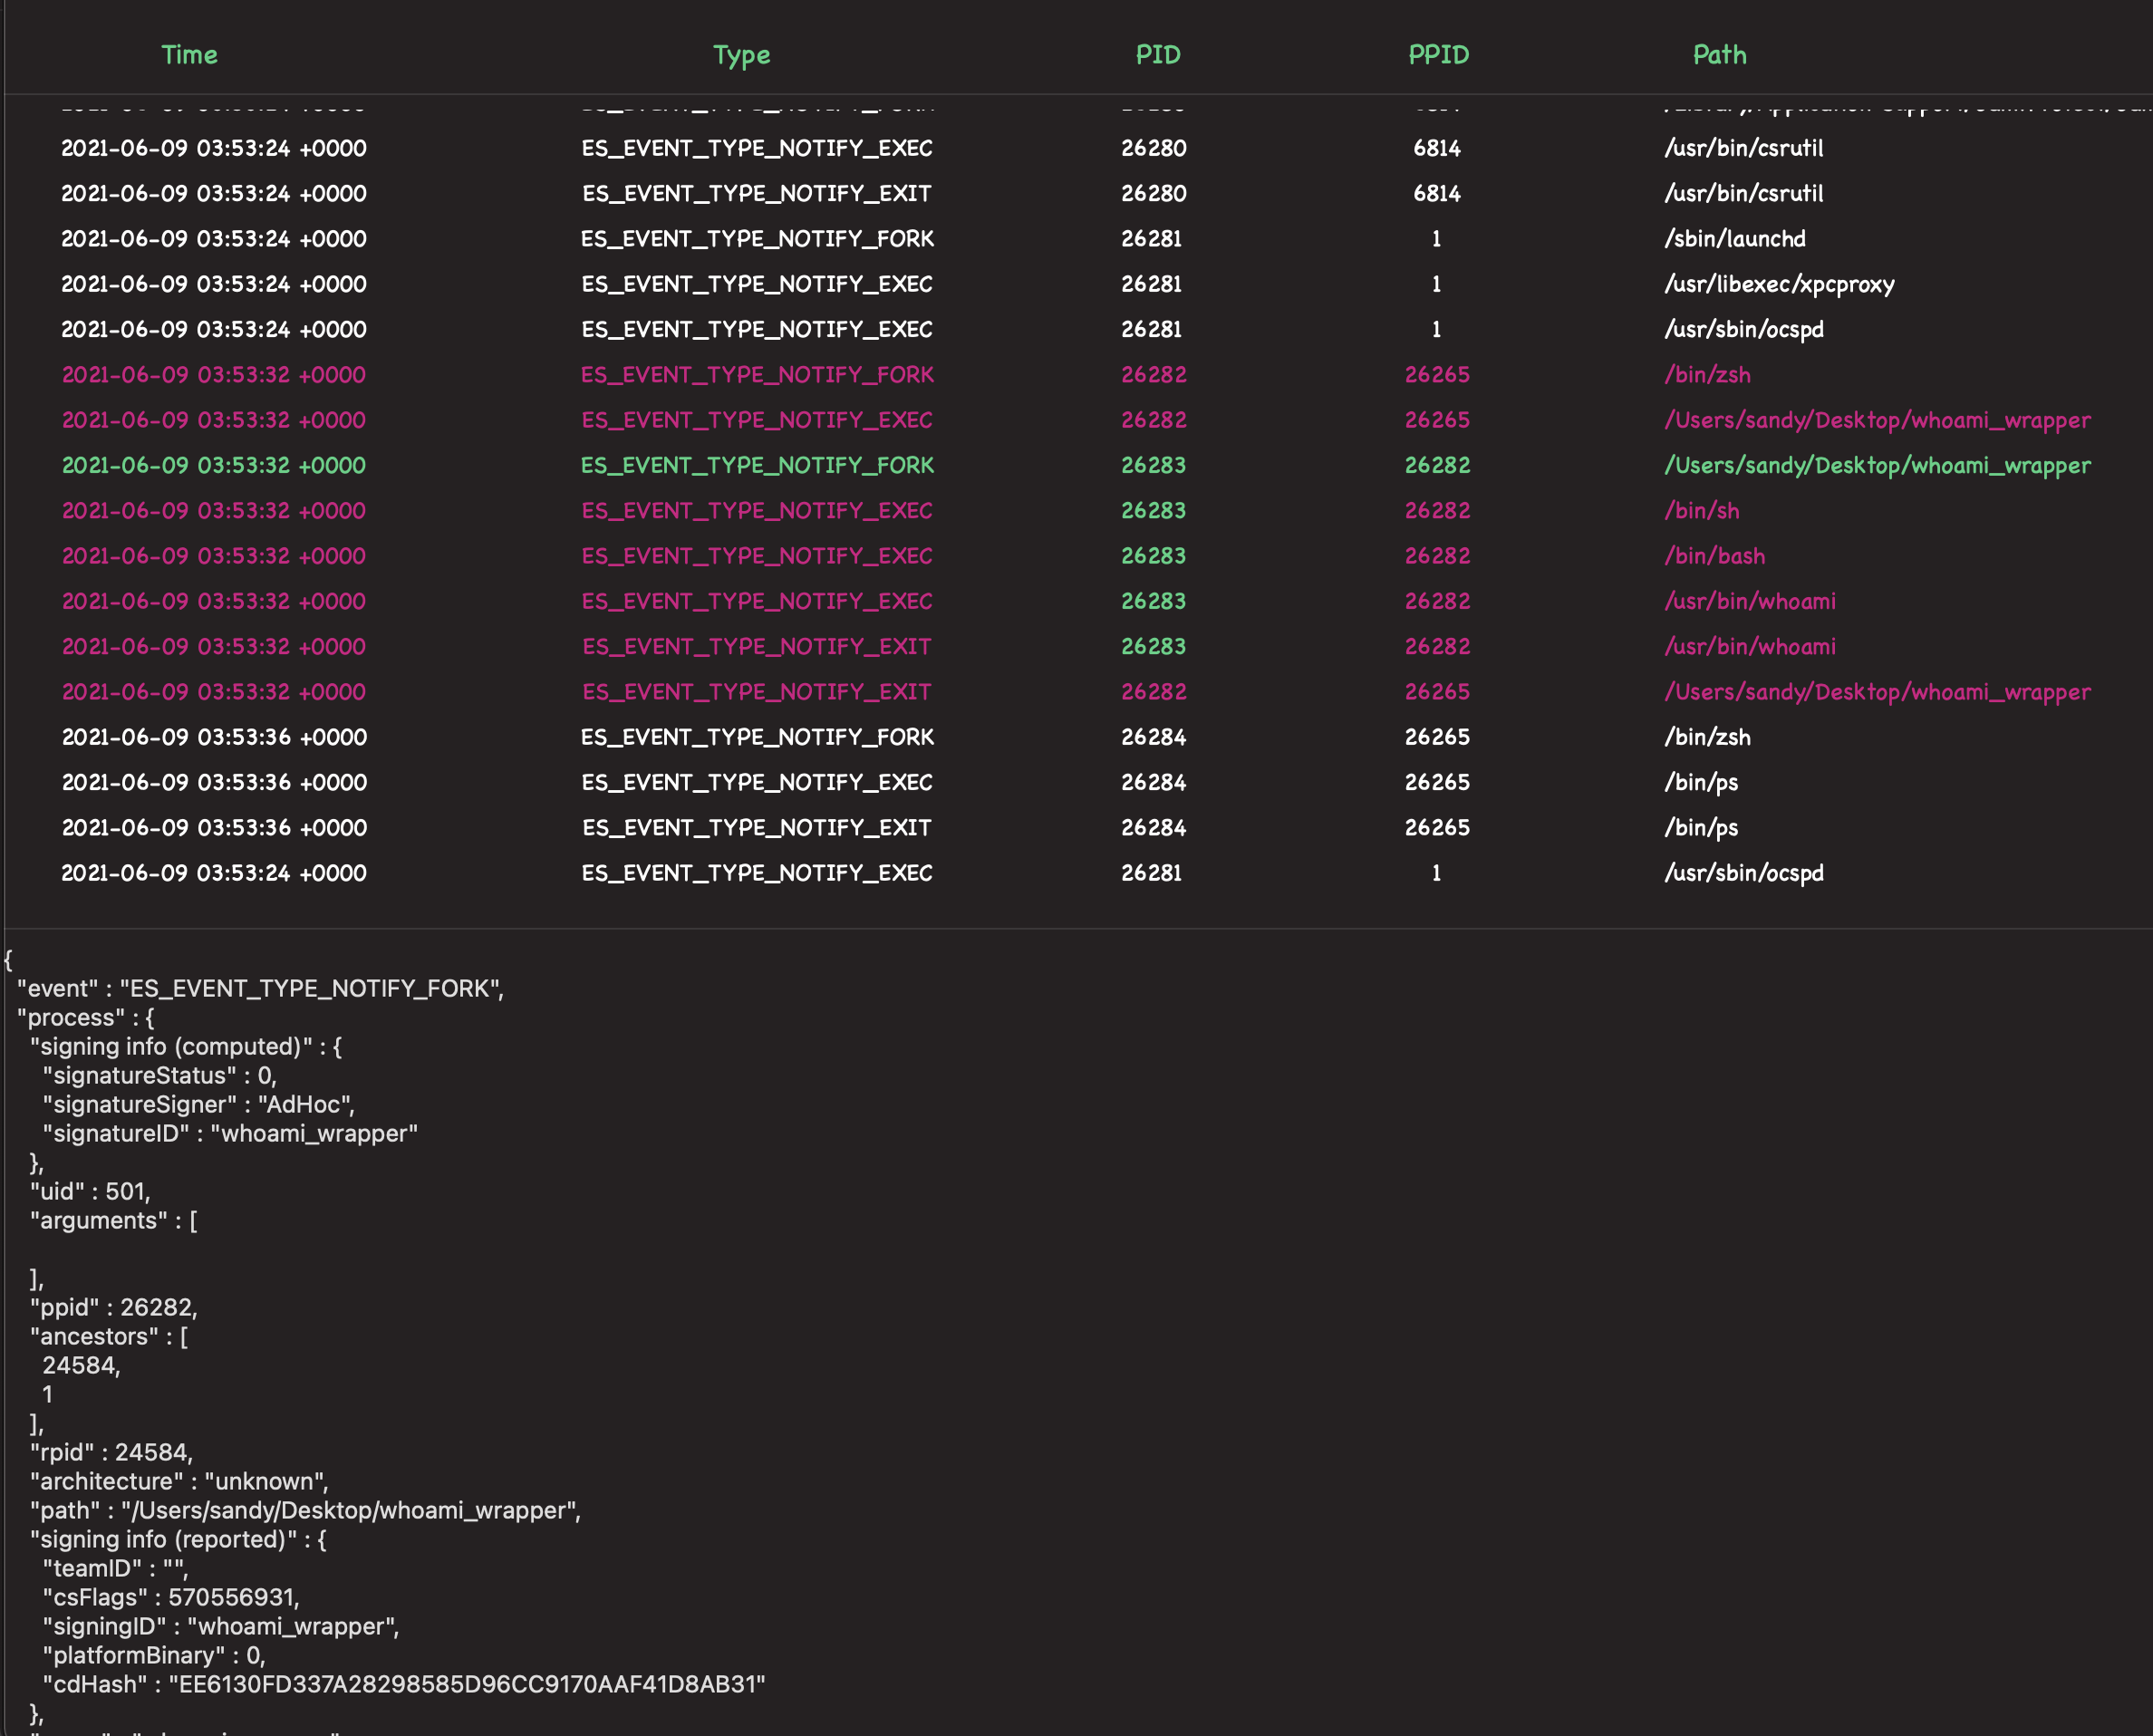
system("whoami") Now we’ll start recording processes using ProcessMonitor and load the resulting file into MonitorUI. After that we will then select the initial execution of whoami_wrapper.

In the above image we’ve selected the initial fork of the whoami_wrapper (which is caused by the system() function running within it). MonitorUI isn’t doing a ton here. All it’s really doing is providing a slightly cleaner way to view the data rather than looking at it in its raw json form. Notice that every event that shares the pid 26283 now has that pid highlighted in green. This makes it a lot easier to track this pid’s life over time. As where any row highlighted entirely in purple is activity belonging to the parent of the process we’ve selected. This color schemes moves as we continue to select different events. And of course as you would expect we get the full details of the event in which we’ve selected.
Upcoming
I of course have greater plans for this tool. It’s primary purpose at the moment was to help me get familiar with SwiftUI which I will say, as someone who doesn’t do much UI work I’m a fan of its simplicity even if it does sometimes lack some of the features I’m looking for.
Some of the basic additions I’d like to get around to adding are…
- Support for file based events (Objective-See’s FileMonitor.app)
- Automatic update checks
- Graphical process tree?
- Allow event recording directly through the application. I have the necessary entitlements to do this, it’s more about finding the time to make it all happen.
We will see what the future holds.


